
I Built an Intelligence Platform That Predicts Markets With 89% Accuracy. Here's How.
Markets move due to humans, so if you track what humans do, it can help you predict them.

I’ve been building nexushq.xyz for a while now. It started as a side project, one of those things where you’re just scratching your own itch, and somewhere along the way it turned into something that genuinely works. The platform is hitting 89% accuracy on market predictions, with most of them confirming within days of being generated. I want to walk you through how I built it, what it actually does, and why the methodology matters more than the tech stack.
This is quite possibly, the most complicated application I’ve ever written in my 20 years as a software engineer, let’s dig into it…
What NEXUS actually is
Imagine Palantir, Bloomberg terminal & Claude had a baby…
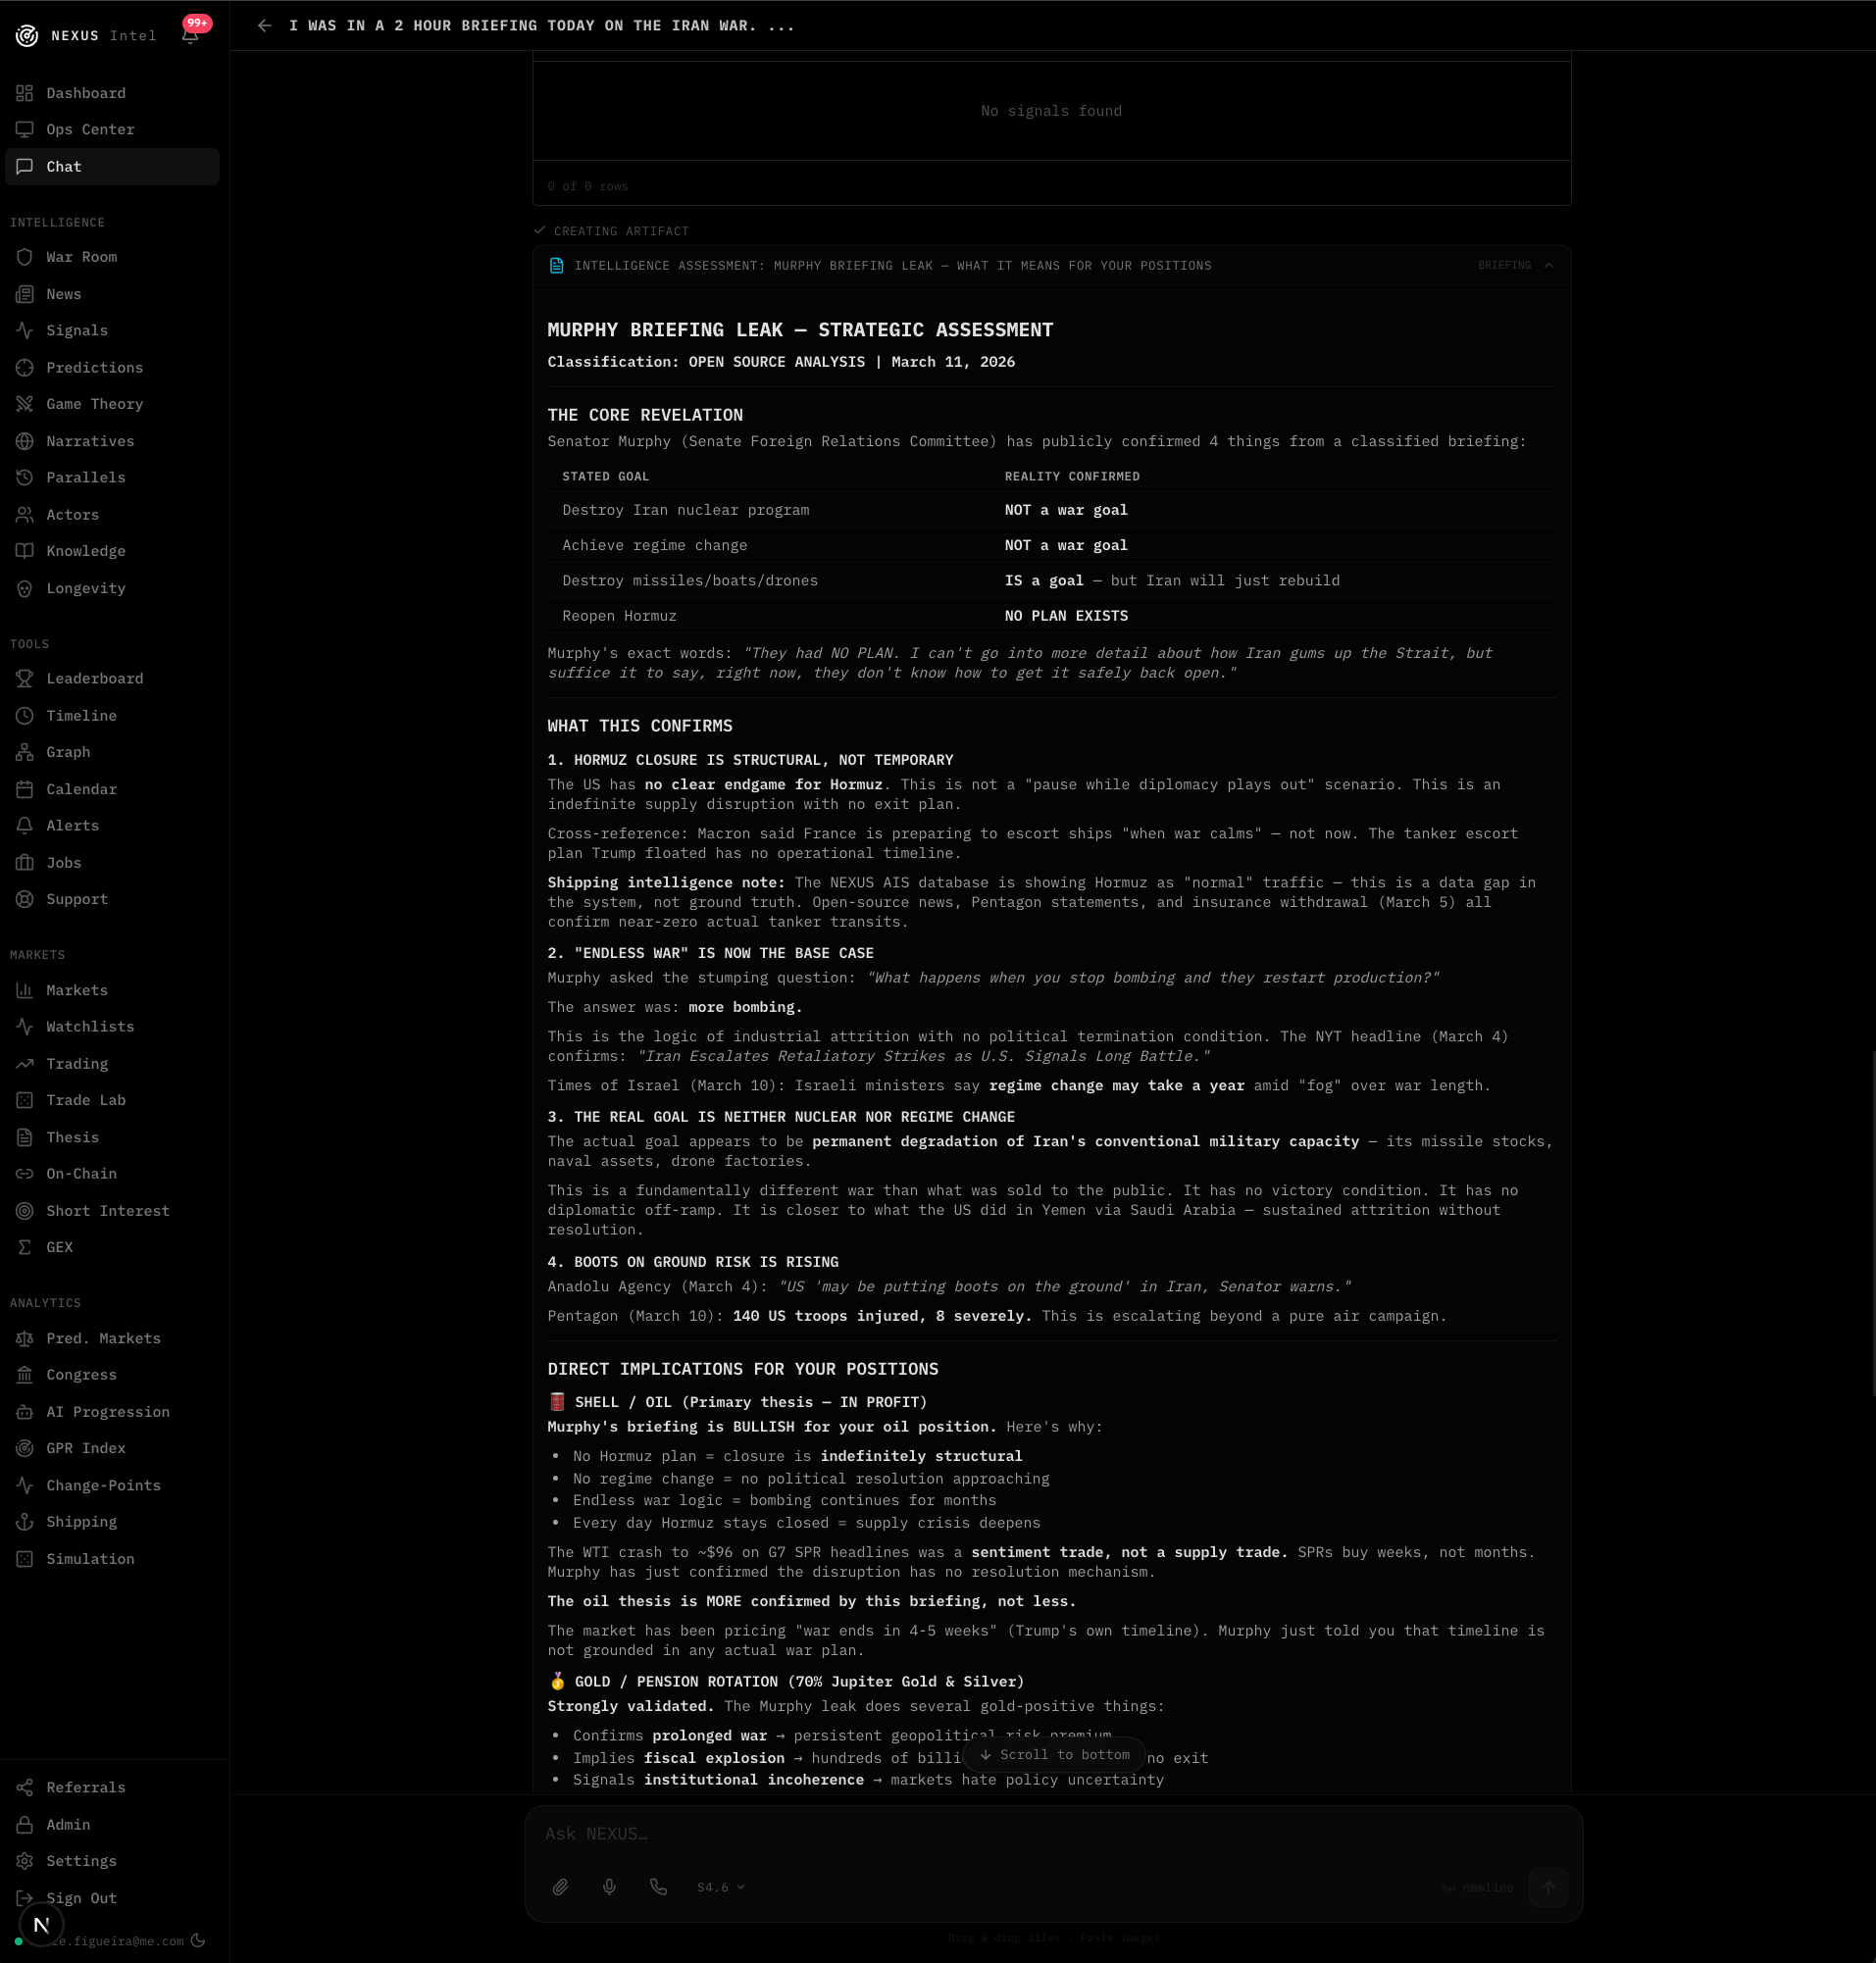
NEXUS is an intelligence platform that watches geopolitical events, market data, and open source intelligence simultaneously and generates falsifiable predictions. It tracks those predictions against reality, scores them rigorously, and feeds the results back into itself to get better over time.
The core idea is simple... markets and geopolitics aren’t separate systems. They’re deeply interconnected, and most analysis treats them as if they exist in isolation. A sanctions announcement moves oil prices. A military exercise shifts capital flows. An election result reprices entire sectors. NEXUS watches all of these things at once rather than in silos.
Why most prediction systems are bullshit
Everyone can make predictions. Almost nobody tracks them honestly.
Go look at any financial newsletter, any geopolitical analyst, any macro Twitter account. They’ll happily screenshot their wins and quietly delete their misses. There’s no timestamped record, no confidence level attached, no objective resolution criteria. It’s pure narrative.
NEXUS doesn’t work that way. Every prediction has a specific, falsifiable claim with a measurable threshold and a hard deadline. “SPY will close below $500 on at least 3 trading days within 14 days” is a valid prediction. “Markets look bearish” is not. You can’t wiggle out of the first one.
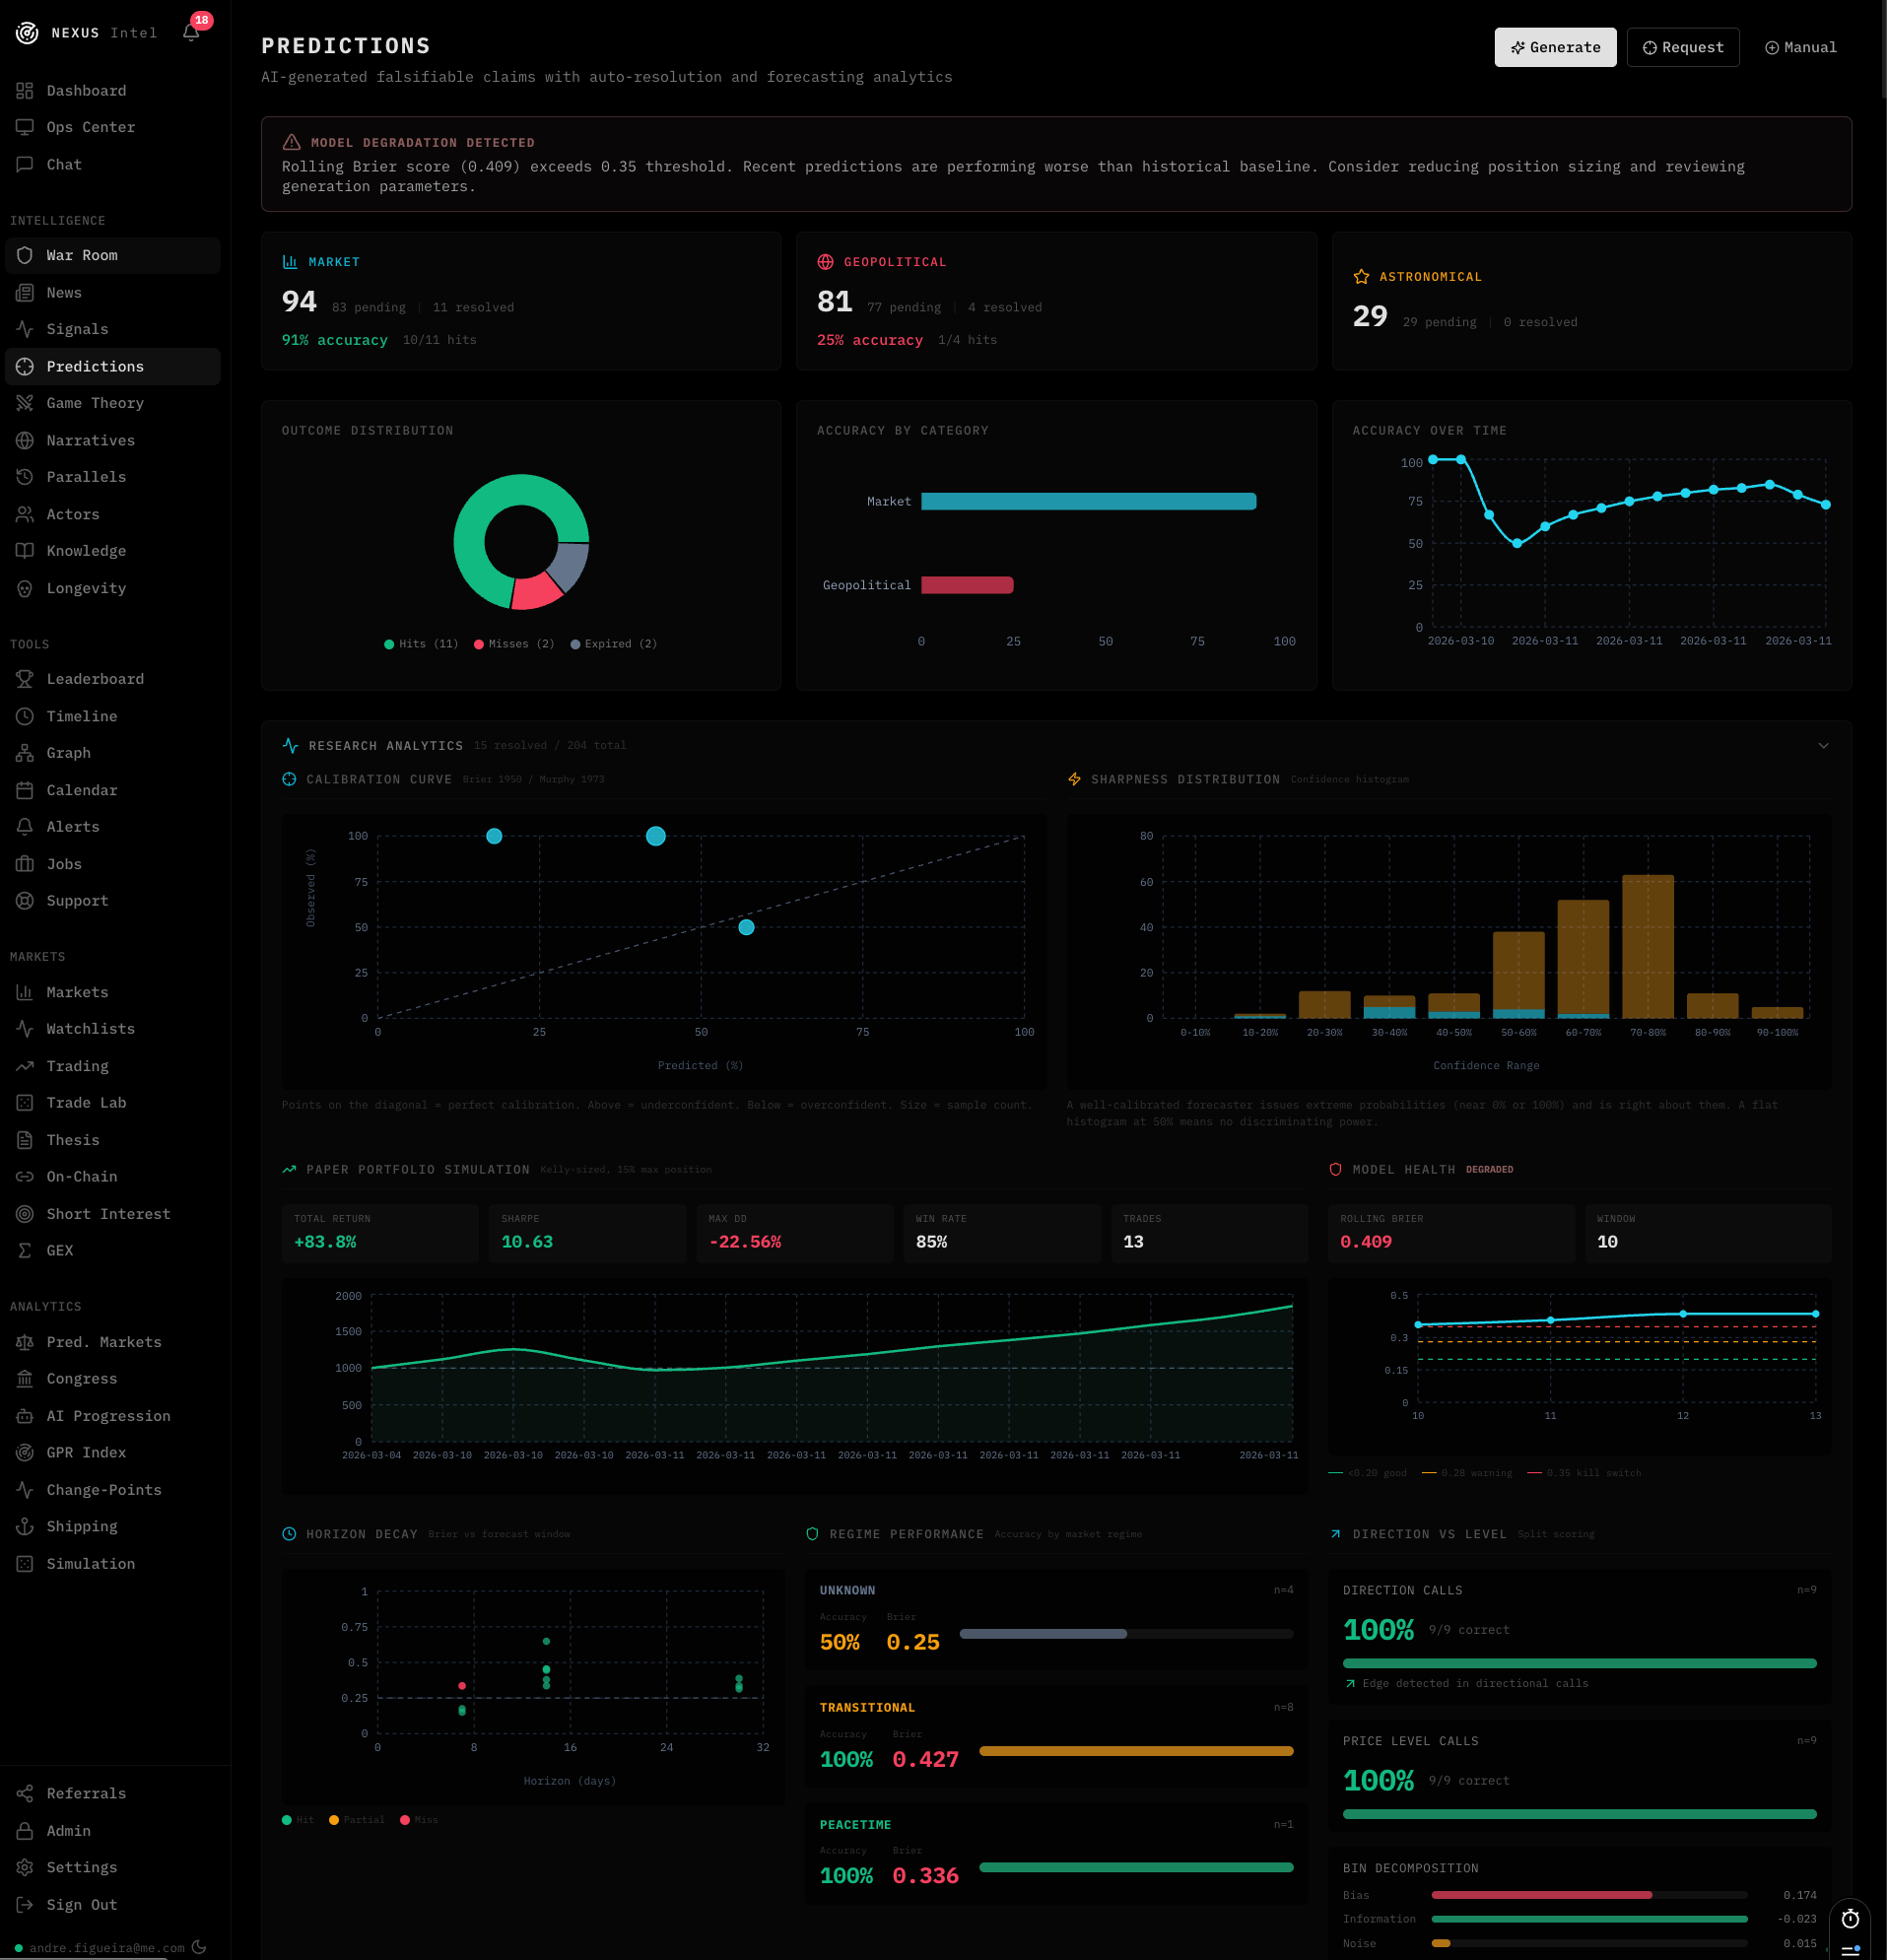
The system uses the Brier score to measure calibration, the same metric used in academic forecasting research and intelligence community assessments. It measures the squared error between your stated confidence and the actual outcome. Lower is better, 0 is perfect, 0.25 is coin-flip baseline. If you say you’re 90% confident and you’re right, great. If you say 90% and you’re wrong, you get punished hard. If you say 40% and you’re right, you also get punished, for not trusting your own signal.
That last part caught us recently. The system was getting predictions right but stating low confidence on them, and the Brier score was tanking. More on that later.
Multiple independent data sources
NEXUS pulls from a bunch of real-world data sources to ground its analysis. Market data, economic indicators, real-time geopolitical event feeds, conflict data. When the system evaluates whether a prediction hit or missed, it has to cite specific numbers and dates. Not vibes or narrative but actual data points.
If the data isn’t available to evaluate a prediction at that moment, the system doesn’t guess. It holds the prediction open and retries on the next cycle. I’d rather have a delayed resolution than a wrong one because an API was temporarily down.
The platform also maintains a knowledge bank with semantic search across historical events and resolved predictions. When generating new predictions, it pulls structural parallels from history, things that rhyme with the current situation. It’s a guard against recency bias, forcing the system to consider base rates before getting excited about the current narrative.
The self-correcting feedback loop
This is what makes NEXUS actually scientific rather than just another AI wrapper.
Every time predictions resolve, the system computes a full performance report. Accuracy by category, accuracy by timeframe, calibration gaps, failure patterns. That report feeds directly back into the prediction generator. If the system has been overconfident in a particular domain, the next batch adjusts. If a certain timeframe is performing well, the system learns to trust that window.
The correction is gradual and damped so it doesn’t oscillate. You don’t want the system overcorrecting from overconfident to underconfident and back again every cycle. It converges toward true calibration over time.
We caught an interesting bug with this recently. The system was hitting 100% on market predictions but the Brier score was getting worse. Turns out the confidence levels were being artificially suppressed by rules I’d written early on when the system was overconfident. The predictions were right every time, but the system was stating 40% confidence on things it should have been stating 75% on. Brier punishes underconfidence just as hard as overconfidence.
The fix was making the confidence rules dynamic, driven by actual track record data rather than my assumptions from months ago. The feedback loop was already computing the right adjustment, the hardcoded rules were just overriding it. Once I removed those constraints and let the system trust its own calibration data, everything clicked.
Adversarial challenge
Every prediction batch gets challenged before it ships. A separate process argues against the prevailing thesis direction, identifies what would need to be true for the analysis to be completely wrong, and names the weakest assumptions. The prediction generator has to contend with the strongest counterarguments before assigning confidence levels.
It’s structured disagreement, borrowed from how intelligence agencies stress-test assessments. You don’t want a system that just confirms its own bias. You want one that’s been punched in the face by its own devil’s advocate and still stands.
The tech
Built on Next.js 15, React 19, TypeScript, Rust and PostgreSQL for the data layer with vector embeddings for semantic search. Tailwind and Radix UI for the interface. Anthropic’s Claude for AI analysis and prediction generation. Voyage AI for embeddings.
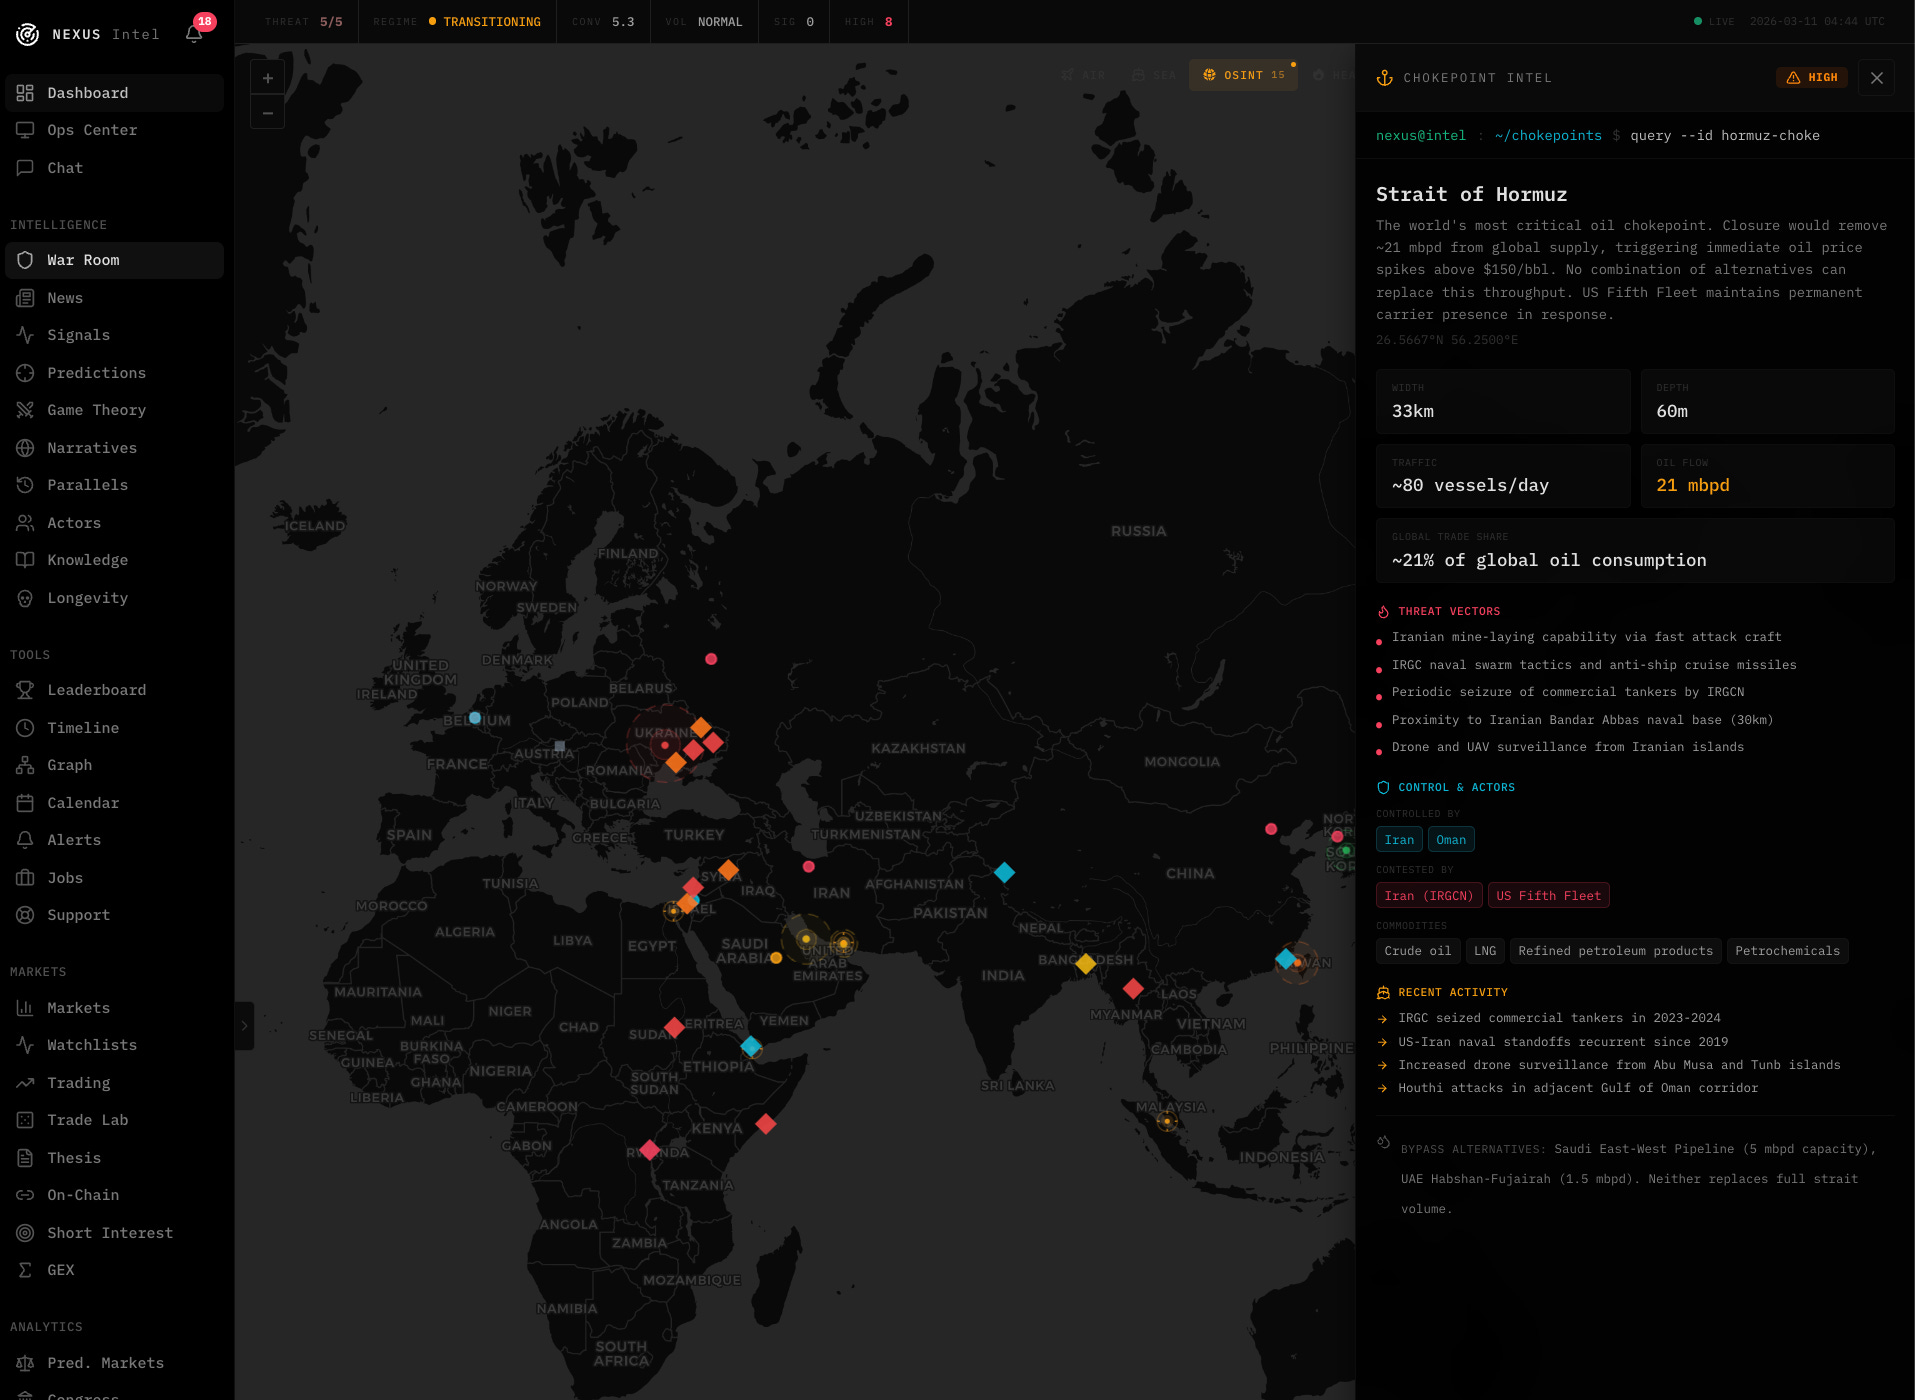
There’s a War Room with real-time tracking overlays on a map, live data feeds, and a 3D globe view. It looks cool, but honestly the tech stack is the least interesting part of the whole thing. You could build this on different tools and the results would be similar. The methodology is what matters.
What I actually learned building this
The hard part of prediction isn’t the prediction itself, it’s the scoring. When you track every call you make with timestamps, confidence levels, and objective resolution criteria, you discover uncomfortable things about your own calibration. That discomfort is where the improvement comes from.
The system started overconfident. The data showed that clearly. Then we corrected too hard and it became underconfident, stating 40% confidence on predictions it was getting right 89% of the time. The feedback loop caught that too, and now it’s converging toward something that actually matches reality.
The self-correcting property is what I’m most proud of. NEXUS watches its own performance, identifies where it’s miscalibrated, and adjusts. Not perfectly, not instantly, but consistently and in the right direction. It doesn’t need me to tune it.
89% accuracy on market predictions is real, and the predictions are resolving fast, most within days of being generated. Whether that holds across a larger sample and different market conditions is the open question, and I’m transparent about that. The sample is still early. But the methodology is sound, the scoring is rigorous, and the system is designed to tell me honestly when it stops working. That’s more than most things in this space can say.
If you’re interested you can get in touch on hello@nexushq.xyz and learn more at our website nexushq.xyz
